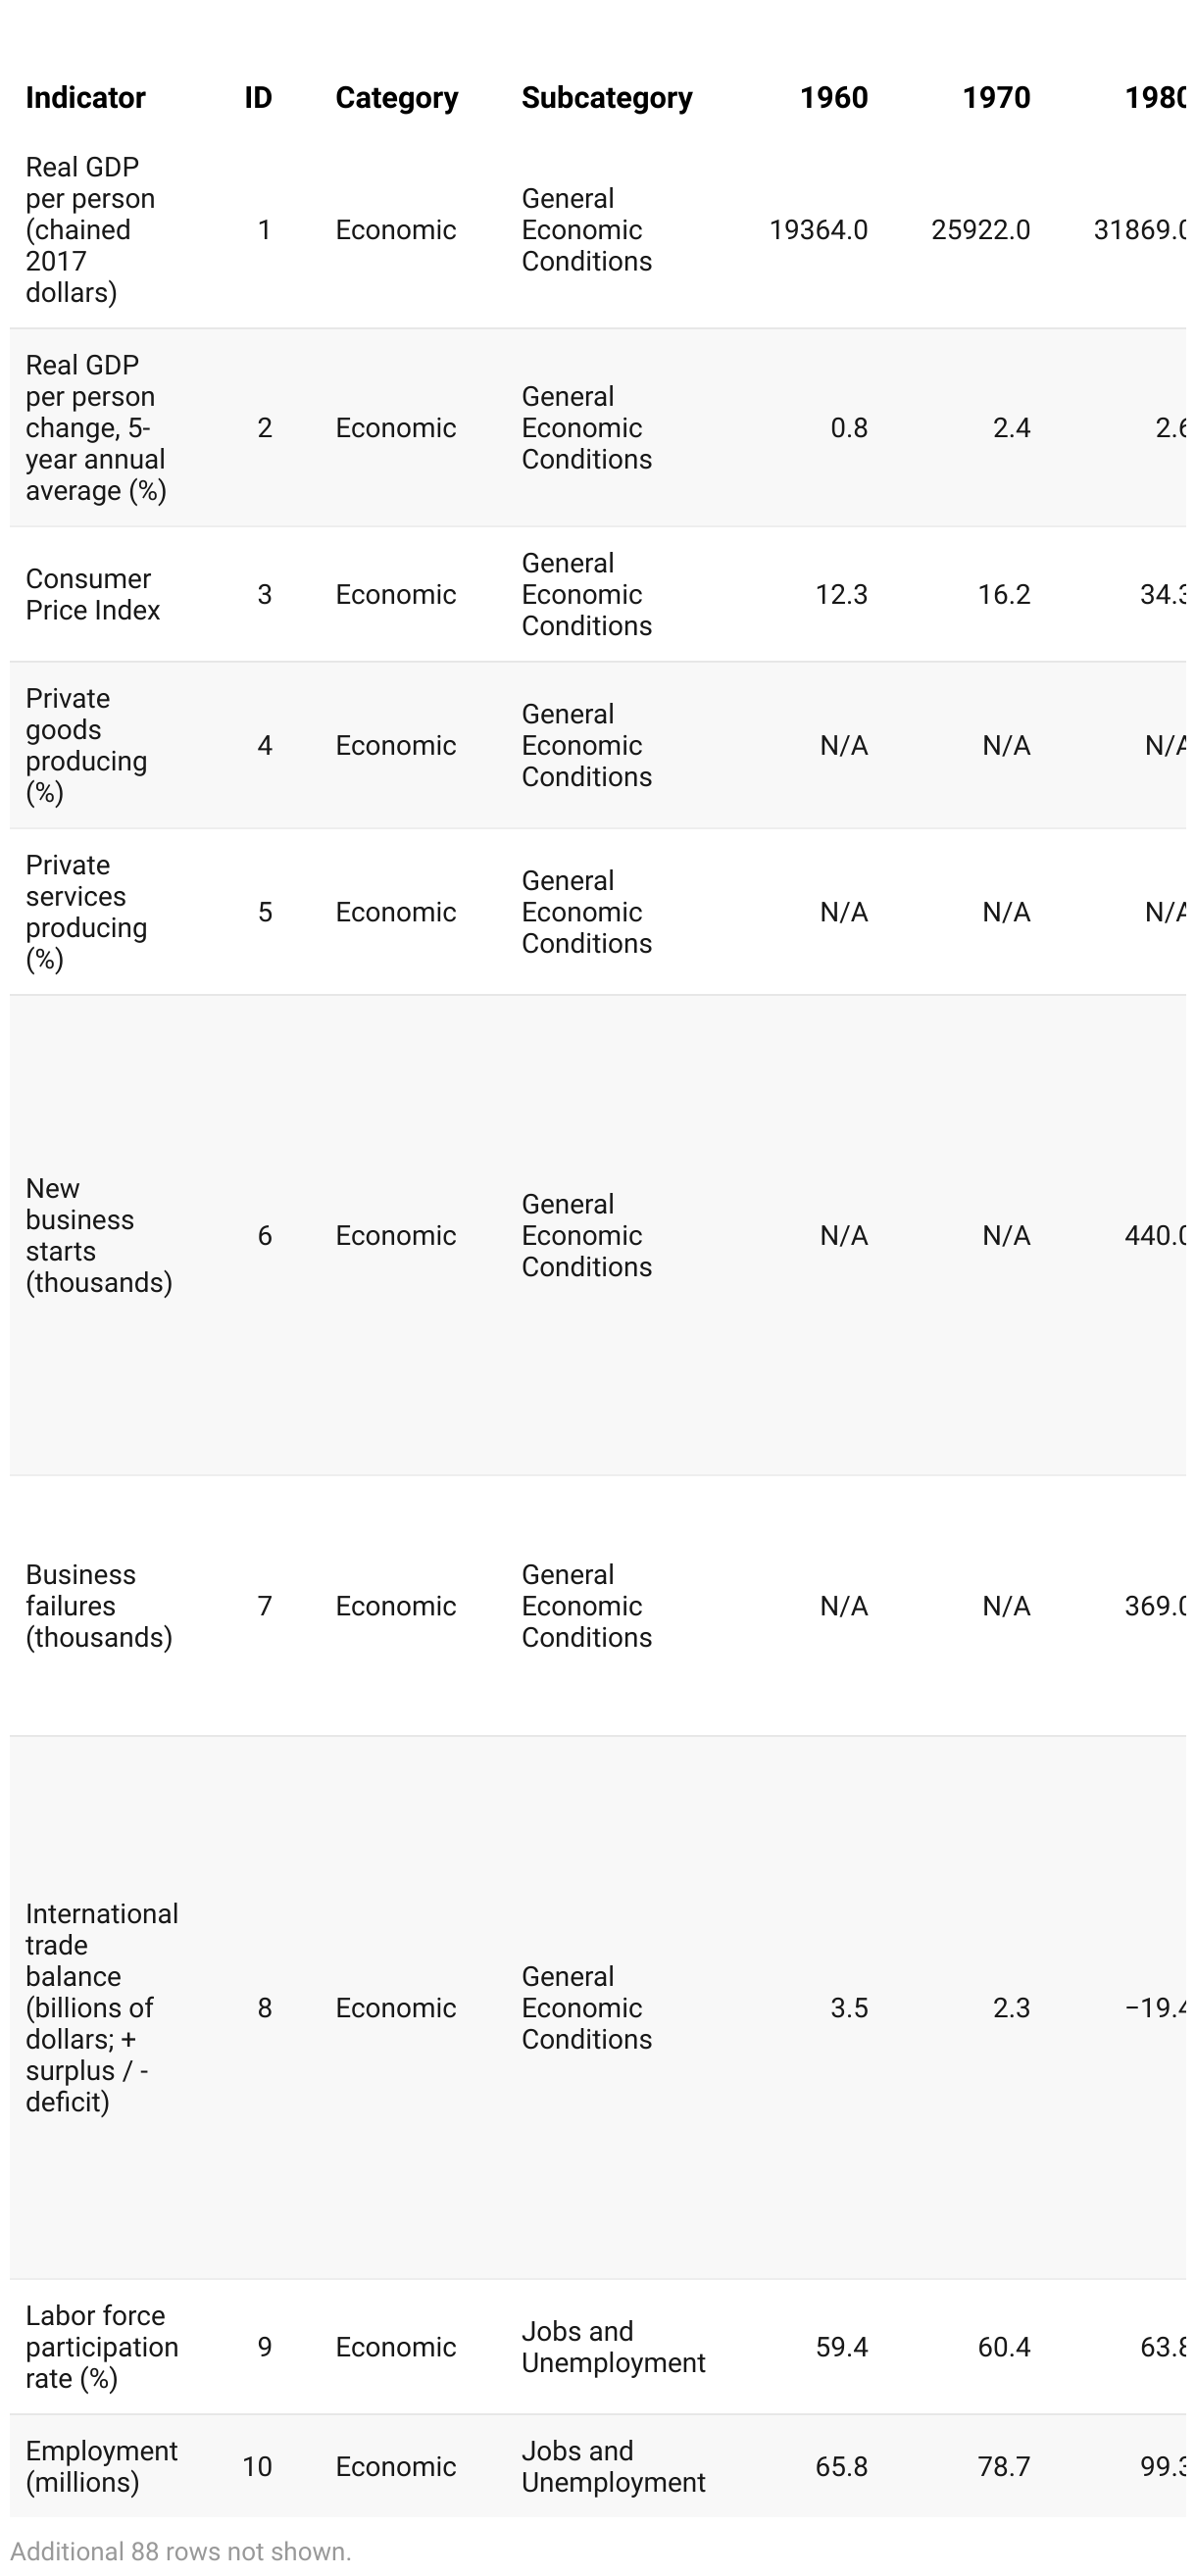
U.S. Social Indicators
98 ways to measure the state of the Nation
The social indicators presented in the Analytical Perspectives volume of the President's Budget illustrate in broad terms how the Nation is faring across six selected domains: economic, demographic, socioeconomic, health, safety and civic, and environment and energy.
These indicators were chosen in consultation with statistical and data experts from across the Federal Government. While they are only a subset of the vast array of available data on conditions in the United States, they can offer a quantitative picture of the progress toward some of the ultimate ends that Government policy is intended to promote.
In choosing indicators for these tables, priority was given to measures that are broadly relevant to Americans and consistently available over an extended period. Such indicators provide a current snapshot while also making it easier to draw comparisons and establish trends.

Footnotes
- Adjusted CPI-U. 2016=100.
- New business starts are defined as firms with positive employment in the current year and no paid employment in any prior year of the LBD. Employment is measured as of the payroll period including March 12th.
- Business failures are defined as firms with employment in the prior year that have no paid employees in the current year.
- Calculated as the value of U.S. exports of goods and services less the value of U.S. imports of goods and services, on a balance of payments basis. This balance is a component of the U.S. International Transactions (Balance of Payments) Accounts.
- Gross prevalence rate for persons receiving Social Security disabled-worker benefits among the estimated population insured in the event of disability at end of year. Gross rates do not account for changes in the age and sex composition of the insured population over time.
- Values for prior years have been revised from the prior version of this publication.
- Data correspond to years 1972, 1982, 1992, 1996, 2000, 2004, 2008, and 2012.
- Patent data adjusted by OMB to incorporate total population estimates from U.S. Census Bureau.
- The data point for 2018 is estimated and may be revised in the next report of this time series. The R&D to GDP ratio data reflect the methodology introduced in the 2013 comprehensive revision of the GDP and other National Income and Product Accounts by the U.S. Bureau of Economic Analysis (BEA). In late July 2013, BEA reported GDP and related statistics that were revised back to 1929. This GDP methodology treats R&D as investment in all sectors of the economy, among other methodological changes. For further details see NSF's InfoBrief "R&D Recognized as Investment in U.S. Gross Domestic Product Statistics: GDP Increase Slightly Lowers R&D-to-GDP Ratio" at http://www.nsf.gov/statistics/2015/nsf15315/nsf15315.pdf.
- Data sources and values for 2020 to 2023 have been updated relative to the prior version of this publication. Differences observed between 2019 and 2020 may be due in part to the change in data sources and not necessarily reflective of trends in the data. For example, the data for 2010 to 2019 are based on the population estimates released for July 1, 2020 and have not yet been adjusted to account for the results of the 2020 Census. Because the data for 2020 take the results of the 2020 Census into account, this results in an "error of closure" between the data for 2019 and 2020 whereby differences are inherent to the two sources of data and not necessarily reflective of demographic trends.
- Data source for 1960 to 2000 is the decennial census; data source for 2006, 2010, 2011, 2012, 2013, 2014, 2015, 2016, and 2017 is the American Community Survey.
- For 1960, age 14 and older.
- Average size of family households. Family households are those in which there is someone present who is related to the householder by birth, marriage, or adoption.
- For 1960, includes those who have completed 4 years of high school or beyond. For 1970 and 1980, includes those who have completed 12 years of school or beyond. For 1990 onward, includes those who have completed a high school diploma or the equivalent.
- For 1960 to 1980, includes those who have completed 4 or more years of college. From 1990 onward, includes those who have a bachelor's degree or higher.
- Data correspond to years 1971, 1980, 1990, 1999, 2004, and 2012. Beginning with 2004, data are based on revised assessments that, among other changes, includes students tested with accommodations.
- Data correspond to years 1973, 1982, 1990, 1999, 2004, and 2012. Beginning with 2004, data are based on revised assessments that, among other changes, includes students tested with accommodations.
- Science and engineering degrees include majors with a 2020 Classification of Instructional Programs (CIP) designation in the areas of computer and information sciences, engineering and engineering technologies, biological and biological sciences, mathematics and statistics, physical science, or science technologies.
- Beginning with 2013, data are based on redesigned income questions. The source of the 2013 data is a portion of the CPS ASEC sample which received the redesigned income questions, approximately 30,000 addresses. For more information, please see the report Income and Poverty in the United States: 2014, U.S. Census Bureau, Current Population Reports, P60-252. Beginning in 2017, the data reflect the implementation of an updated processing system. For more information, please see the report Income and Poverty in the United States: 2018, U.S. Census Bureau, Current Population Reports P60-266.
- Foreign remittances, referred to as 'personal transfers' in the U.S. International Transactions (Balance of Payments) Accounts, consist of all transfers in cash or in kind sent by the foreign-born population resident in the United States to households resident abroad. Adjusted by OMB to 2016 dollars using the CPI-U.
- The poverty rate does not reflect noncash government transfers. The CPS ASEC has undergone changes to the processing system and questionnaire over time. Estimates from 2017 onward reflect the implementation of an updated processing system. The most recent changes to the questionnaire occurred in 2014. For more information, please see the report Poverty in the United States: 2022, U.S. Census Bureau, Current Population Reports, P60–280.
- Food-insecure classification is based on reports of three or more conditions that characterize households when they are having difficulty obtaining adequate food, out of a total of 10 questions for households without children and 18 questions for households with children.
- Data values shown are 1962, 1983, 1989, 2001, 2004, 2010, 2013, 2016, 2019, and 2022. For 1962, the data source is the SFCC; for subsequent years, the data source is the SCF.
- Data for even years was interpolated.
- Expenditures for housing and utilities exceed 50 percent of reported income. Data for even years was interpolated.
- Inadequate housing has moderate to severe problems, usually poor plumbing, or heating or upkeep problems. Data for even years was interpolated.
- Disability in children aged 5-17 is defined by responses in 13 core functioning domains: 1) seeing, 2) hearing, 3) mobility, 4) self-care, 5) communication, 6) learning, 7) remembering, 8) concentrating, 9) accepting change, 10) controlling behavior, 11) making friends, 12) anxiety, and 13) depression. Children who were reported to have “a lot of difficulty” or “cannot do at all” to at least one of the first 11 domains or "daily" to domains 12 or 13 are classified in the “disability” category.
- Disability is defined by level of difficulty in six domains of functioning: 1) vision, 2) hearing, 3) mobility, 4) communication, 5) cognition, and 6) self-care. Persons indicating "a lot of difficulty," or "cannot do at all/unable to do" in at least one domain are classified in "disability" category.
- Starting with 2020 data, regular physical activity is defined as participation in leisure-time aerobic and muscle-strengthening activities that meet the 2018 Physical Activity Guidelines for Americans. Aerobic guidelines for adults recommend at least 150 to 300 minutes a week of moderate-intensity, or 75 to 150 minutes a week of vigorous-intensity, or an equivalent combination of moderate- and vigorous-intensity aerobic activity. Muscle-strengthening guidelines for adults recommend activities of moderate or greater intensity involving all major muscle groups on 2 days a week or more. Before 2020, regular physical activity was based on the 2008 federal physical activity guidelines for adults that recommended at least 150 minutes (2 hours and 30 minutes) a week of moderate-intensity, or 75 minutes (1 hour and 15 minutes) a week of vigorous-intensity aerobic physical activity, or an equivalent combination of moderate- and vigorous-intensity aerobic activity. The 2008 federal physical activity guidelines also recommend that adults perform muscle-strengthening activities that are moderate or high intensity and involve all major muscle groups on 2 or more days a week. Due to the redesign of the National Health Interview Survey in 2019, use caution when comparing 2020 and 2022 data with data from previous years.
- BMI refers to body mass index. The 1960, 1980, 1990, 2000, 2005, 2010, 2014, 2016, 2018 data correspond to survey years 1960-1962, 1976-1980, 1988-1994, 1999-2000, 2005-2006, 2009-2010, 2013-2014, 2015-2016, and 2017-2018, respectively.
- Percentage at or above the sex-and age-specific 95th percentile BMI cutoff points from the 2000 CDC growth charts. The 1980, 1990, 2000, 2005, 2010, 2014, 2016, 2018 data correspond to survey years 1976-1980, 1988-1994, 1999-2000, 2005-2006, 2009-2010, 2013-2014, 2015-2016, and 2017-2018, respectively.
- Heavier drinking is based on self-reported responses to questions about average alcohol consumption and is defined as, on average, more than 14 drinks per week for men and more than 7 drinks per week for women.
- Includes only employees of private-sector establishments that offer health insurance. Adjusted to 2021 dollars by OMB.
- Unpublished data. This is the mean total private health insurance premium paid by an individual or family for the private coverage that person is on. If a person is covered by more than one plan, the premiums for the plans are added together. Those who pay no premiums towards their plans are included in the estimates. In 2019 the National Health Interview Survey (NHIS) questionnaire was redesigned to better meet the needs of data users. Therefore, estimates based on NHIS from 2019 moving forward may not be strictly comparable to those prior to 2019. Adjusted to 2021 dollars by OMB.
- A person was defined as uninsured if he or she did not have any private health insurance, Medicare, Medicaid, CHIP (1999-2021), state-sponsored, other government-sponsored health plan (1997-2021), or military plan. Beginning in 2014, a person with health insurance coverage through the Health Insurance Marketplace or state-based exchanges was considered to have private coverage. A person was also defined as uninsured if he or she had only Indian Health Service coverage or had only a private plan that paid for one type of service such as accidents or dental care. In 1993-1996 Medicaid coverage is estimated through a survey question about having Medicaid in the past month and through participation in Aid to Families with Dependent Children (AFDC) or Supplemental Security Income (SSI) programs. In 1997 to 2021, Medicaid coverage is estimated through a question about current Medicaid coverage. Beginning in the third quarter of 2004, a Medicaid probe question was added to reduce potential errors in reporting Medicaid status. Persons under age 65 with no reported coverage were asked explicitly about Medicaid coverage. In 2019 the National Health Interview Survey (NHIS) questionnaire was redesigned to better meet the needs of data users. Therefore, estimates based on NHIS from 2019 moving forward may not be strictly comparable to those prior to 2019.
- Data are reported by birth year. Data for the 2015 birth year are from survey years 2016, 2017, and 2018; data for the 2016 birth year are from survey years 2017, 2018, and 2019; data for the 2017 birth year are from survey years 2018, 2019, and 2020; data for the 2018 birth year are from survey years 2019, 2020, and 2021. Recommended vaccine series consists of 4 or more doses of either the diphtheria, tetanus toxoids, and pertussis vaccine (DTP), the diphtheria and tetanus toxoids vaccine (DT), or the diphtheria, tetanus toxoids, and acellular pertussis vaccine (DTaP); 3 or more doses of any poliovirus vaccine; 1 or more doses of a measles-containing vaccine (MCV); 3 or more doses or 4 or more doses of Haemophilus influenzae type b vaccine (Hib) depending on Hib vaccine product type (full series Hib); 3 or more doses of hepatitis B vaccine; 1 or more doses of varicella vaccine; and 4 or more doses of pneumococcal conjugate vaccine (PCV). Data are reported by birth year. Data for the 2010 birth year are from survey years 2011, 2012, and 2013; data for the 2015 birth year are from survey years 2016, 2017, and 2018; data for the 2016 birth year are from survey years 2017, 2018, and 2019; data for the 2017 birth year are from survey years 2018, 2019, and 2020; data for the 2018 birth year are from survey years 2019, 2020, and 2021; data for the 2019 birth year are from survey years 2020, 2021, and 2022; data for the 2020 birth year are considered preliminary and are from survey years 2021 and 2022 (data from survey year 2023 are not yet available). Recommended vaccine series consists of 4 or more doses of either the diphtheria, tetanus toxoids, and pertussis vaccine (DTP), the diphtheria and tetanus toxoids vaccine (DT), or the diphtheria, tetanus toxoids, and acellular pertussis vaccine (DTaP); 3 or more doses of any poliovirus vaccine; 1 or more doses of a measles-containing vaccine (MCV); 3 or more doses or 4 or more doses of Haemophilus influenzae type b vaccine (Hib) depending on Hib vaccine product type (full series Hib); 3 or more doses of hepatitis B vaccine; 1 or more doses of varicella vaccine; and 4 or more doses of pneumococcal conjugate vaccine (PCV).
- Property crimes, including burglary, motor vehicle theft, and other theft, reported by a sample of households. Every 10 years, the National Crime Victimization Survey (NCVS) sample is redesigned to reflect changes in the population. To permit cross-year comparisons that were inhibited by the 2016 sample redesign, BJS created a revised data file. Estimates for 2016 are based on the revised file and replace previously published estimates. For more information, see Criminal Victimization, 2016 (Revised), available at https://bjs.ojp.gov/redirect-legacy/content/pub/pdf/cv16re.pdf.
- Violent crimes include rape and sexual assault, robbery, aggravated assault, and simple assault. Includes crimes both reported and not reported to law enforcement. Due to methodological changes in the enumeration method for NCVS estimates from 1993 to present, use caution when comparing 1980 and 1990 criminal victimization estimates to future years. Estimates from 1995 and beyond include a small number of victimizations, referred to as series victimizations, using a new counting strategy. High-frequency repeat victimizations, or series victimizations, are six or more similar but separate victimizations that occur with such frequency that the victim is unable to recall each individual event or describe each event in detail. Including series victimizations in national estimates can substantially increase the number and rate of violent victimization; however, trends in violence are generally similar regardless of whether series victimizations are included. See Methods for Counting High-Frequency Repeat Victimizations in the National Crime Victimization Survey, NCJ 237308, BJS web, April 2012 for further discussion of the new counting strategy and supporting research. Every 10 years, the National Crime Victimization Survey (NCVS) sample is redesigned to reflect changes in the population. To permit cross-year comparisons that were inhibited by the 2016 sample redesign, BJS created a revised data file. Estimates for 2016 are based on the revised file and replace previously published estimates. For more information, see Criminal Victimization, 2016 (Revised), available https://bjs.ojp.gov/redirect-legacy/content/pub/pdf/cv16re.pdf.
- Estimates of the murder rate per 100,000 persons are taken from the FBI's Uniform Crime Reporting (UCR) Program. Estimates for 2021 and 2022 are based on a revised statistical methodology and may not be directly comparable to the murder rates estimated for previous years.
- For the purposes of this report, the prison incarceration rate is a "custody plus privates"-based rate, meaning that it includes all persons held in state or federal publicly operated prison facilities and private facilities contracted to state or federal departments of corrections, but does NOT include prisoners housed in local jails with the exception of those housed in the six combined prison/jail system states (Alaska, Connecticut, Delaware, Hawaii, Rhode Island, Vermont). Prisoners of all sentence length and statuses are included in this report. This statistic corresponds to the prison incarceration rate published by BJS in its annual Corrections Populations in the United States, YYYY bulletin. (Prior to 1977, the National Prisoners Statistics (NPS) Program reports were based on custody population (not including either private prisons or jails). Beginning in 1977, BJS changed the official statistic for the prison population to a jurisdiction count, so rates prior to 1977 should not be compared directly to those published after 1977. As stated, the estimate provided does not include prisoners held in local jails, although under the pure definition of jurisdiction (legal authority over the person regardless of where s/he is held), prisoners in jails would be included.)
- For all years, the actuals reflect Active Component only excluding full-time Reserve Component (RC) members and RC mobilized to active duty.
- Note: A traffic fatality is defined as a death that occurs within 30 days after a traffic crash.
- Charitable giving reported as itemized deductions on Schedule A.
- Data correspond to years 1964, 1972, 1980, 1992, 1996, 2000, 2004, 2008, 2012, 2016, and 2020. The voting statistics in this table are presented as ratios of official voting tallies, as reported by the U.S. Clerk of the House, to population estimates from the Current Population Survey.
- Indicator reflects the estimated share of Americans who volunteered through an organization at least once in the previous year. The figure for 1990 refers to an estimate from the May 1989 Current Population Survey (CPS) Multiple Job Holding, Flexitime, and Volunteer Work Supplement. Figures for 2002-2015 refer to estimates from the CPS Volunteering Supplement sponsored by the Corporation for National and Community Service annually in September. From 2017 on, figures refer to estimates from the CPS Civic Engagement and Volunteering (CEV) Supplement sponsored by the Corporation for National and Community Service dba AmeriCorps biennially in September. The increase between 2015 and 2017 likely reflects order effects related to transitioning from the Volunteering to CEV supplement questionnaire. All CEV data and documentation is publicly available at http://data.americorps.gov. Estimates for 2023 will be published in late 2024.
- The 1980, 1990, 2000, 2005, and 2010 data come from the 1982, 1992, 2002, 2008, and 2012 waves of the Survey of Public Participation in the Arts, respectively. The 2017 and 2022 data come from the Survey of Public Participation in the Arts. Data from all other years are from the Arts Basic Survey. Survey items may have slight variations across years.
- The 1980, 1990, 2000, 2005, and 2010 data come from the 1982, 1992, 2002, 2008, and 2012 waves of the Survey of Public Participation in the Arts, respectively. The 2017 and 2022 data come from the Survey of Public Participation in the Arts. Data from all other years are from the Arts Basic Survey. The wording and placement of questions differed across survey years, and the indicator for arts creation in future years will strive for greater consistency.
- Ambient ozone concentrations based on 132 monitoring sites meeting minimum completeness criteria.
- Ambient PM2.5 concentrations based on 361 monitoring sites meeting minimum completeness criteria.
- 2023 annual mean value is preliminary.
- The gross emissions indicator does not include emissions and sinks from the Land Use, Land Use Change and Forestry sector. Emissions or sequestration of CO2, as well as emissions of CH4 and N2O, can occur from management of lands in their current use or as lands are converted to other land uses.. Gross emissions are therefore more indicative of trends in energy consumption and efficiency than are net emissions. See https://www.epa.gov/ghgemissions/inventory-us-greenhouse-gas-emissions-and-sinks
- Percent of the population served by community water systems that receive drinking water that meets all applicable health - based drinking water standards.
- Includes net generation from solar thermal and photovoltaic (PV) energy at utility-scale facilities. Does not include distributed (small-scale) solar thermal or photovoltaic generation.
- Dry natural gas is also known as consumer-grade natural gas.